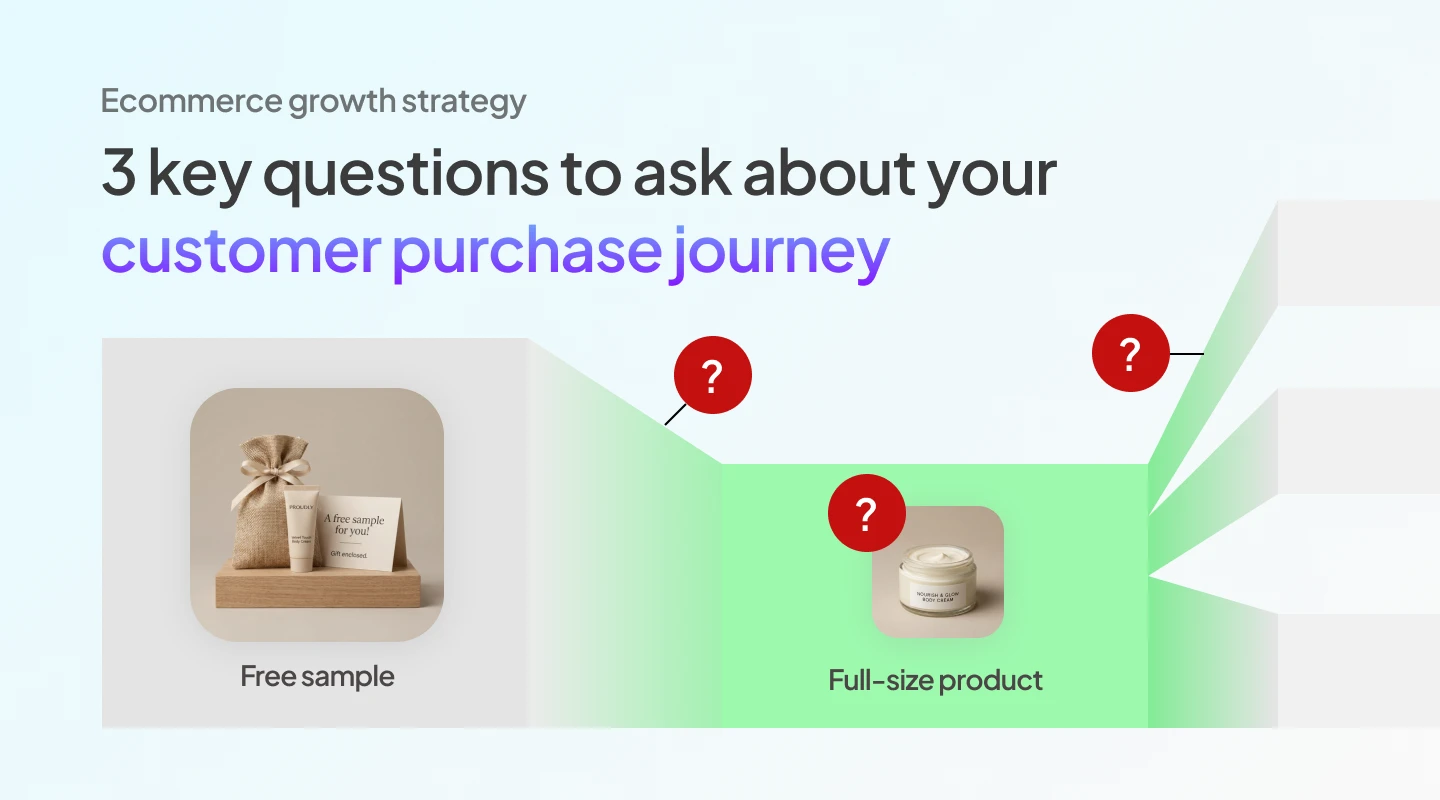
.webp)
What is Cohort Analysis?
Cohorts are groups of individuals with a shared characteristic — usually, but not always, based on a specific action within a specific time frame. For example, a cohort based on “first purchase” would show all customers broken down into groups based on when they first shopped in your store.
By slicing data into different cohorts (first purchase, first purchased product, discount usage, etc.), we can conduct a cohort analysis, a form of segmentation focused on historical data. We can use cohorts to spot changes in customer behaviors throughout their journey.
A real analysis we’ve done looks at whether customers who shop for the first time during the Q4 holidays will behave differently to those who shop for the first time during the summer. Comparing these two cohorts can tell us a lot, such as
- How do these groups of customers differ in their purchasing behavior?
- How can we time our outreach emails based on that behavior?
- What messaging can we tailor to each group to encourage repeat purchases?
Examples of cohorts
In Segments, we have a few different cohort analytics.
The very first one we built is the “customer cohort” module that controls for a customer’s “first purchase” month, and calculates their spend in subsequent months at fixed 30-day intervals, from the first 30 days to a full year later (for Growth+ plan stores, we extend the analysis out to 2 years or more).

Each row in the table above represents a customer cohort based on when the customer made their first purchase. For each cohort, we have two sets of metrics: summary statistics and pattern statistics.
Summary statistics looks at the cohort's entire history, answerings questions such as:
- How many customers are in this cohort?
- How many orders have these customers made since signing up?
- How much total revenue has this cohort generated?
- What is their average order value (AOV)?
Pattern statistics show a metric changing across time. In our screenshot above we are looking at the changing average revenue per user (ARPU) across subsequent months M1, M2, etc., where M1 represents 30 days after initial purchase, M2 60 days, and so forth. Cohorts based on a dynamic grouping time have an interesting “descending stair” pattern, since the most recent month (July 2021 in the screenshot above) has only 1 month of elapsed time, while the oldest month (August 2020) has the full year’s worth of data. To compare apples to apples, we can look down each “M#” column to answer questions like:
- Are my customers spending more or less over time in the first 30 days of their first purchase?
- Which months did I do particularly well (or not) in nurturing first time customers to purchase again within 30 days of their first purchase?
- Are there any noticeable anomalies in customer purchase behavior in specific months after their first purchase?
How do you calculate customer cohorts?
If you’re an Excel junkie, you can think of cohorts as a pivot table, grouping by the “first purchase month” as each row, and adding the purchase month + 30 days in increments for the column values. These values aren’t super straightforward to calculate in a spreadsheet though, so it’s easier to use something a bit more robust (here, we use SQL) to do the grouping and projecting.
Assuming you have access to a relational database of your Shopify data, you can use SQL queries like the below example to transform and manipulate your orders data to get the same customer cohort data:
In the subquery aliased customer_first_order, we query our customer’s first order date by using the GROUP BY statement to grab their earliest order date. Then we join back on orders (aliased o) to get order data (like revenue or subtotal price), and self-join on orders again (this time aliased o2) to find all subsequent orders after each customer’s first order. The SELECT projection then groups by the first order’s month, and aggregates the sum of all subsequent 30-day increments of revenue to get the M# values.
The SQL query looks complicated, but really boils down to the same logic as the spreadsheet method: grouping by the first order month, and summing subsequent order revenues.
Conclusion
We talked about why cohorts are useful, examples of their usage, and the logic behind calculating customer cohorts. Hopefully this post has been useful in illuminating what’s happening underneath the fancy-looking “descending stairs” cohort tables. There are other cohort tables, like first purchase discount cohorts, that look slightly different since they’re grouping by different variables. We’ll look at those for another time!

Author Bio:
Dan Park is the Staff Data Scientist at Segments by Tresl. Dan loves to tell stories with data. He has over a decade of experience in a variety of fields translating data to actionable insights. As a data science consultant Dan has helped business leaders across Fortune 100 companies make strategic data-driven decisions based on advanced analytics and in-depth research.
Want to learn more about Segments and how our 30+ prebuilt customer segments, lifecycle grid and product journey maps can help drive long term, sustainable growth for your Shopify store? Get in touch today.
Authored by
Tresl Data Science Team

George Sylvain
George Sylvain is a San Francisco-based DTC expert and co-founder of Social Print Studio, known for transforming e-commerce strategies into success stories. Visit his insights on AI and Shopify at www.georgesylvain.com.

Sharad Thaper

Alex Greifeld